December is when most content plans for the new year get written. The best ones start with a look back. Your analytics already know which videos people finished, which devices they watched on and what they paid for. Here are seven streaming metrics worth checking before you plan January.
In Bamboo, every analytics page has date range options at the top. Choose Custom to review the period you care about, such as the last quarter or the months since your last review.
1. Watch Time
Where: Analytics overview and Video Performance.
Watch Time is the total time viewers spent watching. Compare it across months to see your busiest seasons. Did a holiday series or a back-to-school push stand out? That’s a pattern you can plan around next year.
2. Average Time per Play
Where: Video Performance (Avg Time per play).
Total watch time can rise just because you published more. Average time per play tells you how long each viewing actually lasts. If it’s short across the board, look at your openings: are viewers getting to the point fast enough?
3. The 75% Rate
Where: Video Performance.
The 75% Rate is the share of plays where viewers watched at least three-quarters of the video. It’s one of the clearest signs of content that holds attention. Sort by it to find your strongest formats, then make more of them.
4. The Engagement Funnel
Where: Analytics overview and Video Performance.
The funnel shows how many plays reached 25%, 50% and 75%, and how many completed. A big drop early means the opening isn’t landing. A drop near the end often means the video runs long. Either way, it helps identify where viewers lose interest.
5. Top Content
Where: Top Videos (overview) and Top Content (Video Performance).
Your most-played videos show what attracts viewers, but most-played doesn’t automatically mean best-performing. Compare each top video’s plays with its average watch time and 75% Rate. A video that’s popular and watched to the end is a strong candidate for a sequel, a new season or a featured row on your home page.
6. Platform and Country Breakdown
Where: Platform Breakdown, Geographic Distribution and Top Countries.
Are people watching on phones, laptops or TVs? If a large share watches on TV, longer formats and 24/7 channels may suit them. If viewers are spread across countries, think about start times for live events and captions in other languages.
7. Revenue
Where: Analytics > Revenue Analytics.
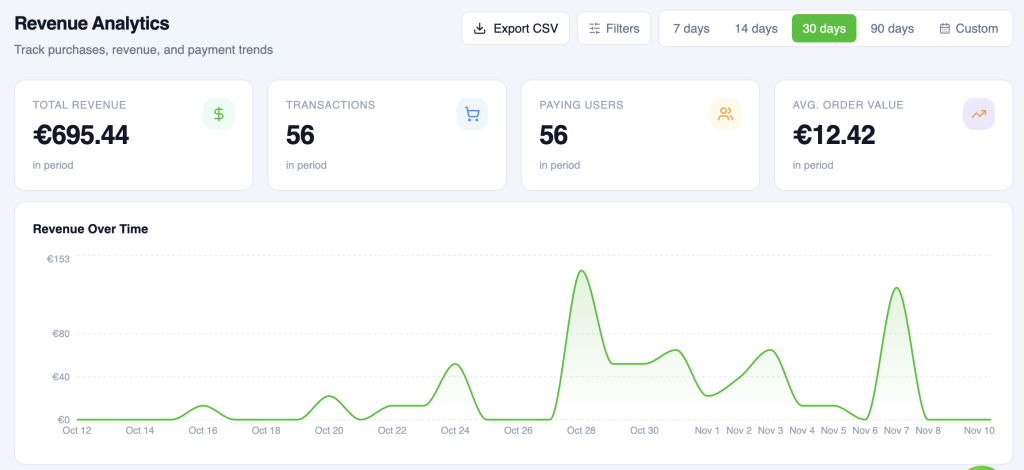
If you sell subscriptions or Pay-Per-View, check total revenue, transactions, paying users and average order value. Compare them with the content you released in the same period. If purchases picked up around a launch, that doesn’t prove the launch caused them, but it’s a pattern worth investigating before you plan your next offer.
Don’t Forget Your Live Streams
The Live & Channels page has its own summary, plays over time and a list of your channels and live streams. Look at which live events drew the most plays, and use that to plan next year’s live calendar.
Turn Your Streaming Metrics Into a Plan
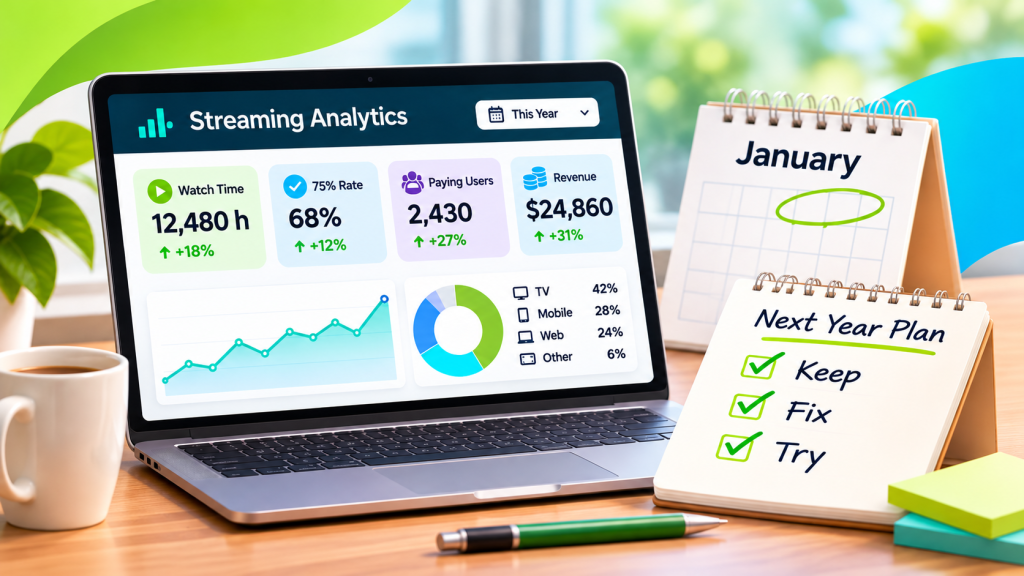
Once you’ve reviewed all seven streaming metrics, write down three things:
- Keep: the formats and series that performed best.
- Fix: the videos or openings where viewers dropped off.
- Try: one new idea based on what the data suggests.
Need the raw numbers? Use Export CSV on Video Performance, or Export on a single section, and bring them into your planning spreadsheet.
Ready for your year-end review? Open your dashboard
Don’t have an account yet? Start your free trial today.